Chapter 2
Summarizing Data
Learning Outcomes
- Use appropriate visualizations for different types of data (e.g. histogram, barplot, scatterplot, boxplot, etc.).
- Use different measures of center and spread and be able to describe the robustness of different statistics.
- Describe the shape of distributions vis-a-vis histograms and boxplots.
- Create and intepret contingency and frequency tables (one- and two-way tables).
Supplemental Readings
- OpenIntro Statistics slides
- ggplot2 -
ggplot2is an R package by Wickham that implements the grammer of graphics (Wilkinson, 2005) in R. I will frequently make use of the graphing framework throughout the course and is worth learning. - Visualizing Likert Data - An R package for visualizing Likert scale data built on the
ggplot2framework. - Quick-R base graphics - Covers many of the visualizations using R’s base graphics.
Videos
Summarizing and Graphing Numerical Data
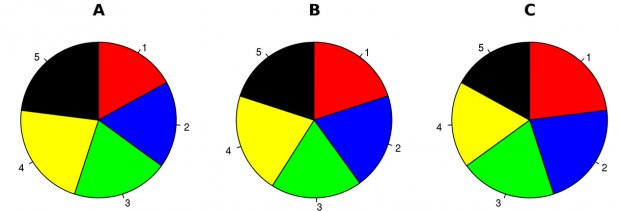
Note about Pie Charts
There is only one pie chart in OpenIntro Statistics (Diez, Barr, & ??etinkaya-Rundel, 2015, p. 48). Consider the following three pie charts that represent the preference of five different colors. Is there a difference between the three pie charts? This is probably a difficult to answer.
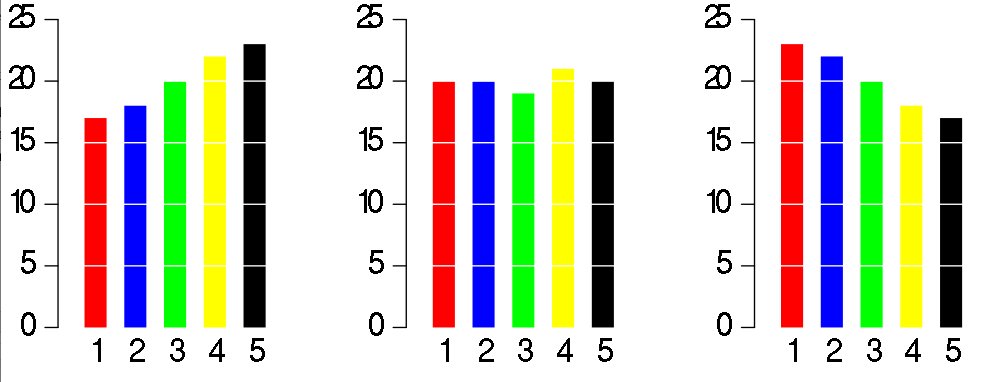
However, consider the bar plot below. Here, we cleary see there is a difference between the ratio of the three colors. As John Tukey famously said:
There is no data that can be displayed in a pie chart that cannot better be displayed in some other type of chart
Source: https://en.wikipedia.org/wiki/Pie_chart.